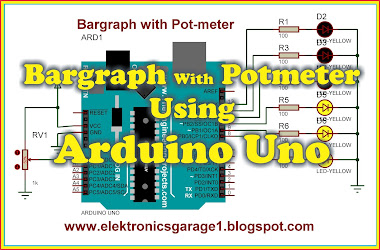
Bar-graph is the combination of LEDs in a Line that mostly
use to display the level of the signal.
Applications:
We also use it to show the water, gas pressure, temperature, and light intensity levels also. Simply its general purpose use can use where you want to show / indicate the level of any measured value. It’s important so I decided to include it in this manual (which’s for beginners).
Components:
Bar-Graph:
We can use this bar graph as shown in the diagram but I have selected only 6 LEDs as bar-graph with Arduino because 6 LEDs bar-graph not available in Proteus for simulation but practically you can use this by extending the code as well.
Circuit Diagram:
Bar graph with POt-meter using PIC Controller
Here I am using ADC (built-in) to read the value of the pot-meter and how its works I have discussed this in a previous Project (Fading LED with Pot-meter).
As we know that 10bit ADC max
value is 210 = 1024 which is divided by no of LEDs.
As
Now put the condition in coding that when the value of ADC >170 then ON 1st LED. (See in coding)
Download Code


Theresa Fox of Chicago - $500K Casino Bonus | JSMH
ReplyDeleteTheresa Fox of 삼척 출장마사지 Chicago is a 양주 출장안마 real estate 수원 출장샵 developer with a history of developing, operating, and operating 통영 출장샵 an impressive hotel and 양산 출장안마 casino, The Casino at the Wynn